
Khanh Hoang - Kenn
Kenn is a user experience designer and front end developer who enjoys creating beautiful and usable web and mobile experiences.
When I am theming a Drupal site, I need to know which variables are available on a template file. In Drupal 8, the template engine is Twig, so we’re going to need to know a little bit of Twig to make this work. So, if Twig is totally new to you, don’t worry. Today, you’ll learn some Twig!
Update and important note! The following instructions work in the alpha version of Drupal 8 only. In the latest development release, the twig_debug settings are no longer in settings.php. It's in sites/example.settings.local.php and the suggestion is to take that file and copy it into sites/default. (Link to change record.) Thanks to Cottser for the heads-up!
The first thing we need to do is to turn on twig debugging. We’ll need to open up sites/default/settings.php to do that. In settings.php, after searching for "Twig" I found the following section on Twig debugging:
/**
 * Twig debugging:
 *
 * When debugging is enabled:
 * - The markup of each Twig template is surrounded by HTML comments that
 *   contain theming information, such as template file name suggestions.
 * - Note that this debugging markup will cause automated tests that directly
 *   check rendered HTML to fail. When running automated tests, 'twig_debug'
 *   should be set to FALSE.
 * - The dump() function can be used in Twig templates to output information
 *   about template variables.
 * - Twig templates are automatically recompiled whenever the source code
 *   changes (see twig_auto_reload below).
 *
 * Note: changes to this setting will only take effect once the cache is
 * cleared.
 *
 * For more information about debugging Twig templates, see
 * <a href="http://drupal.org/node/1906392">http://drupal.org/node/1906392</a>.
 *
 * Not recommended in production environments (Default: FALSE).
 */
# $settings['twig_debug'] = TRUE;
# $settings['twig_debug'] = TRUE;
becomes
$settings['twig_debug'] = TRUE;
* Remove the pound (#) sign at the beginning of the line. A pound sign (#) enables you to comment out part of a line in Twig. See Comments in Twig for Template Designers.
Now I need to clear the cache. On my Drupal 8 site, I’ll navigate to Configuration > Performance and click the Clear all caches button. While I’m at it, I’ll add this page to my shortcut menu by clicking the star next to the page title, because I haven’t got Drush updated yet. (TODO: Update Drush to a version that supports Drupal 8 on your local.)
In this post, I just want to focus on debugging Twig in a local sandbox environment, so instead of spinning up a new theme, I am going to hack core in this tutorial. (I did cringe a little bit at first, if that helps.)
By "hacking core" what I mean is: I’m going to navigate to core/themes/bartik/templates and open up page.html.twig file in my IDE, phpStorm. (But, you can use whatever text editor or IDE you like, preferable one with some Twig support, like autocompleting all those double curly braces. See Twig for Template Designers for a list of IDEs that support Twig.)
Opening core/templates/Bartik/templates/page.html.twig, I can now add my debugging function…but which one? I can't just drop in a php var_dump into a template file anymore.
Twig has a function called dump() that will, you guessed it, dump all the variables on the page. Now, just so you know, when you try to use dump() on page.html.twig, you’ll probably get a White Screen Of Death (WSOD) because it just takes too much memory to recursively traverse and print all those variables.
But just for starters, let’s say I already know that there’s a variable called breadcrumb that I want to inspect. I'll type this into my page.html.twig file, just below the top comment block. The double curly braces are Twig delimiters, meaning, inside these braces, is Twig. (There's another delimiter and we'll get to that in a moment.)
{{ dump(breadcrumb) }}

But if you don't know the names of the array keys of variables (after all, that's what you're trying to find out!) you can put this in your page.html.twig file:
{{ dump(_context|keys) }}

I know what you’re thinking. You’re thinking, "Ew. That’s supposed to be useful? I WANT PRETTY ARRAYS."
Well, so do I, my friends. So do I.
This information seems important and quite possibly contains data I want to get my hands on, but right now it's neither fun nor easy to read that output. Is there a way I can improve my own developer experience here? The short answer is yes. One method uses your browser's developer tools and the other uses a popular contrib module already beloved by Drupal module developers: Devel.
The browser output of the Twig dump() function doesn't appear all that useful at first glance, but take a peek under the hood by choosing Inspect Element from the right/ctrl-click menu in Chrome or Firefox and you'll discover all sorts of useful comments and formatting. You'll see as HTML comments: template name suggestions for each region and a formatted, one-value-per-line array. Simply viewing source in any browser will also give you access to these valuable comments and improved formatting of the dump() output.

Viewing source definitely improved the experience of debugging our Twig template, but there is another option as well, provided by the Drupal contrib community: Devel and Devel Kint modules. I visited the Devel project issue queue, home of such useful variable and array inspecting goodness such as dpm() and krumo, and searched the Devel 8.x issue queue for Twig. I was delighted to discover that as of last week, yes, there is a pretty and even more useful way to debug variables in Twig!
Here's how:
This enables Devel and the Devel Kint modules. “Kint” is a debugging tool that is replacing Krumo. It enables you to hide and show levels of arrays, which is very useful in the land of the Arrays of Doom that we deal with, for better or worse, in Drupal.
With these modules enabled, now I can put kint() into my page.html.twig file, NOT get a WSOD, and instead, get a traversable formatted widget for digging into the arrays and variables on this page. With Devel and Kint enabled, I can remove my dump() statements and replace them with:
{{ kint() }}

Now, if I click the [+] sign, I can drill down into all these nested arrays, sans wall-of-text!

If you got an error when trying to use kint(), then this bears repeating: you have to have Devel and Devel Kint modules enabled for this function to be available for you to call. Otherwise, you're stuck with dump() for now and you could do clever things described in this comment to make the output more readable.
But we've got Devel and Kint rolling now, so let's take a look how we can make this tool really work for us.
After you’ve inspected all the variables output with kint(), you might want to narrow down your inspection to just one variable. For a top-most key, I could do this:
{{ kint(page) }}
...to output the page variable.

If I wanted to go another level deeper into the page array and output the php equivalent of $page[‘content’], I could do this:
{{ kint(page.content) }}
If things were getting out of hand and I wanted to assign some of these arrays to variables, I could do this:
{% set pagecontent = page.content %}
(You'll notice that instead of double curly braces, I've used the other Twig delimiting syntax using a curly brace and a percent sign.)
And then using kint(), I could debug my new variable like this:
{{ kint(pagecontent) }}
Or an array inside my pagecontent variable:
{{ kint(pagecontent.bartik_content) }}
But what about all those array keys using the pound (#) sign?
{{ kint(page.#show_messages) }}

Ru-roh. Turns out the pound sign (#) and hypen (-) are special characters, so if those characters are in your variable or array key name, an exception will be caught, as they say, and you'll get a website error.
Not a problem, it turns out. All I need to do is switch to a different syntax, the “sub-script” syntax, that actually will likely be familiar to you.
{{ kint(page[‘#show_messages’]) }}
Now it works!

So, hooray for Devel, Kint, and Inspecting Elements! Now we have a much easier way to navigate debugging tool at our disposal for inspecting variables and arrays in a template file that uses Twig.
Much kudos and thanks to Drupal community members Cottser for the initial patch and moshe weitzman for the timely commit in this Devel 8.x issue that brought Kint functionality to Twig template files: https://drupal.org/node/2218949
Happy Twig debugging! Share your tips and tricks using both the dump() and kint() functions in the comments

Kenn is a user experience designer and front end developer who enjoys creating beautiful and usable web and mobile experiences.
![]()


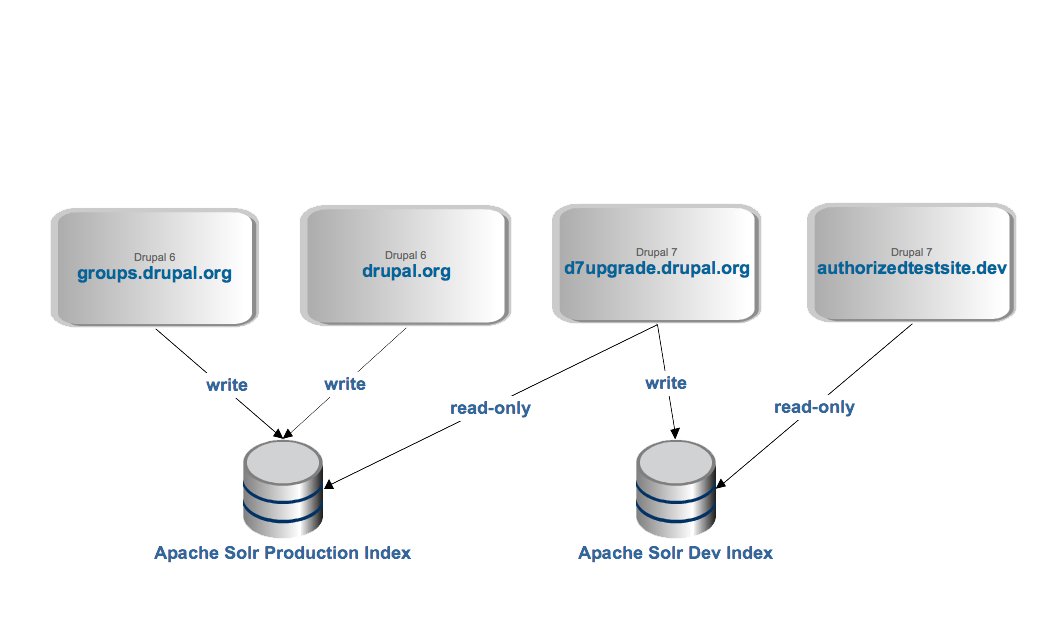
Using this approach, you create an unique Solr core (N.B. a single Solr application can contain 0 or more cores) per site and either:
Thế hệ Google TV tiếp theo sẽ sử dụng bộ vi xử lí ARM sau khi nhà sản xuất chip Marvell cho biết...
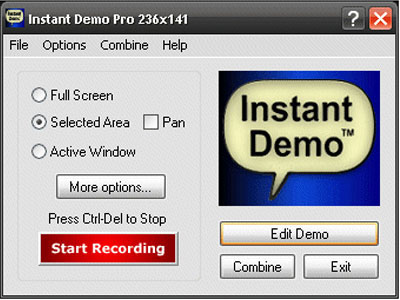
Chắc hẳn đã hơn một lần bạn gặp khó khăn khi trợ giúp khác hàng sử dụng các chương trình phần mềm. Phải Print screen từng bản giao diện một, và viết từng comment một và trong trường hợp phần mềm quá lớn với nhiều tình huống sử dụng. Bạn sẽ mệt mỏi và tốn nhiều thời gian hơn.


